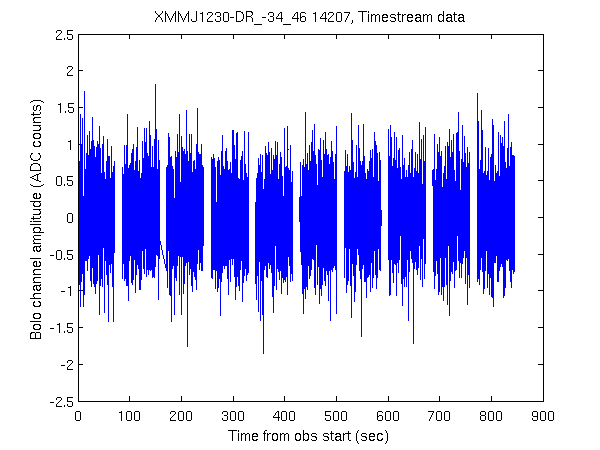
This page shows the timestream psd's after various filter steps. The aim of this analysis was to investigate the effect of the various filters on the timestream noise.
We look at channel 9 from XMMJ1230 scan 14207. This is typically a good channel which passes all the filtering data cuts. Scan 14207 is taken from the final 30% of data. The coadd of the final 30% of data has large striping across the map - a feature which is not seen in the coadd of the first 30% of the map. We start with a semi-processed timestream. The data has already been flagged for optically dead channels, demodulator rails, glitches, low flatfield values, and has a 20th order polysecant removed from the sets of halfscans centred on the same al/el position. When taking the psds, we average the psds of each 4 second subscan. Figure 1. Raw timestream.

Now we compare using the median-flatfield gains to using the gains from the planet calibration file.
Figure 2. Filtered with an annular mean between 2' and 5'. The data is weighted with its flat-field gains.
Figure 3. Filtered with an annular mean between 2' and 5'. The data is weighted with its calibration gains.
Figure 4. PSDs for filtered timestrems.

The flatfield and calibration gains produce the same change in the psd amplitude. The following analysis uses only calibration gains. Now we compare using the MEAN of the annulus between 2' and 5' to using the MEDIAN of the annulus.
Figure 5. Annular Mean template.

Figure 6. Annular Median template.

Figure 7. PSDs for filtered timestreams.

The median and mean of the annulus produce the same change in the psd amplitude Finally, we compare the annular mean filter to the neighbour median filter. The neighbour median filter takes the median signal from the closest 7 channels > 2' away from the channel being processed.
Figure 8. Annular Mean template.

Figure 9. Neighbour median template.

Figure 10. PSDd for filtered timestreams.

This topic: APEX_SZ > WebHome > XMMJ1230 > TimestreamPSDS Topic revision: r1 - 2009-12-06 - JamesKennedy
We look at channel 9 from XMMJ1230 scan 14207. This is typically a good channel which passes all the filtering data cuts. Scan 14207 is taken from the final 30% of data. The coadd of the final 30% of data has large striping across the map - a feature which is not seen in the coadd of the first 30% of the map. We start with a semi-processed timestream. The data has already been flagged for optically dead channels, demodulator rails, glitches, low flatfield values, and has a 20th order polysecant removed from the sets of halfscans centred on the same al/el position. When taking the psds, we average the psds of each 4 second subscan. Figure 1. Raw timestream.

Now we compare using the median-flatfield gains to using the gains from the planet calibration file.
Figure 2. Filtered with an annular mean between 2' and 5'. The data is weighted with its flat-field gains.
Figure 3. Filtered with an annular mean between 2' and 5'. The data is weighted with its calibration gains.
Figure 4. PSDs for filtered timestrems.

The flatfield and calibration gains produce the same change in the psd amplitude. The following analysis uses only calibration gains. Now we compare using the MEAN of the annulus between 2' and 5' to using the MEDIAN of the annulus.
Figure 5. Annular Mean template.

Figure 6. Annular Median template.

Figure 7. PSDs for filtered timestreams.

The median and mean of the annulus produce the same change in the psd amplitude Finally, we compare the annular mean filter to the neighbour median filter. The neighbour median filter takes the median signal from the closest 7 channels > 2' away from the channel being processed.
Figure 8. Annular Mean template.

Figure 9. Neighbour median template.

Figure 10. PSDd for filtered timestreams.

| I | Attachment | Action | Size | Date | Who | Comment |
|---|---|---|---|---|---|---|
| |
annularmean_ts.png | manage | 6.7 K | 2009-12-06 - 22:19 | JamesKennedy | |
| |
annularmedian_ts.png | manage | 6.7 K | 2009-12-06 - 22:19 | JamesKennedy | |
| |
flat_cal_comparison.png | manage | 9.6 K | 2009-12-06 - 22:18 | JamesKennedy | |
| |
mean_median_comparison.png | manage | 9.9 K | 2009-12-06 - 22:18 | JamesKennedy | |
| |
neighbour_mean_comparison.png | manage | 10.0 K | 2009-12-06 - 22:18 | JamesKennedy | |
| |
neighbour_median_ts.png | manage | 6.7 K | 2009-12-06 - 22:24 | JamesKennedy | |
| |
polysecant_ts.png | manage | 6.6 K | 2009-12-06 - 22:19 | JamesKennedy |
This topic: APEX_SZ > WebHome > XMMJ1230 > TimestreamPSDS Topic revision: r1 - 2009-12-06 - JamesKennedy
© 2020 Winterland Cosmology Lab, McGill University, Montréal, Québec, Canada

